This is our second free GED Science practice test. All of these questions are based on the 2024 GED, which has definitely become more challenging over the years. The questions will be on a wide range of topics, with a focus on designing and interpreting science experiments and using charts and graphs in science.
Directions: Choose the best answer to each question.
Congratulations - you have completed .
You scored %%SCORE%% out of %%TOTAL%%.
Your performance has been rated as %%RATING%%
Your answers are highlighted below.
Question 1 |
Animals that feed exclusively on plants are called:
Primary Consumers | |
Secondary Consumers | |
Tertiary Consumers | |
Primary Producers |
Question 1 Explanation:
In an ecological food chain, primary producers are those that photosynthesize and utilize sunlight as their energy source; these are almost entirely plants. Primary consumers attain their energy from primary producers. Secondary consumers feed upon primary consumers, and tertiary consumers feed upon primary and secondary consumers.
Question 2 |
The graph below shows the population of fur seals on one of the Pribilof Islands, a group of volcanic islands near the coast of Alaska. Scientists believe that fur seals first arrived on this island in the year 1902. The red circles are population estimates and the red line is the population trend line.


What is the island's approximate carrying capacity for fur seals?
6,000 | |
10,500 | |
11,500 | |
1,500 |
Question 2 Explanation:
The carrying capacity of a biological species in an environment is the maximum population size of the species that the environment can sustain indefinitely, given the food, habitat, water, and other necessities available in the environment. In this chart the population trend line begins to plateau around 10,500, which indicates that this would be the carrying capacity of the island. Sometimes a population will overshoot the carrying capacity of its ecosystem, but this will cause a shortage of resources, which will in turn lead to an increase in the death rate, bringing the population back to equilibrium.
Question 3 |
Students are researching families with one brown-haired parent and one red-haired parent to understand how recessive hair-color genes interact with dominant genes. They studied the offspring of a heterozygous brown-haired man (Bb) and a homozygous recessive red-haired woman (bb). Of their four children, three have brown hair and one has red hair. The students prepared the Punnett square that is shown below.


If the couple has another child, what is the probability that this child will have brown hair?
0% | |
25% | |
50% | |
75% |
Question 3 Explanation:
Heterozygous indicates two different genes for a hereditary characteristic. In this case, the man is heterozygous because he has one gene for brown hair (B) and one gene for red hair (b). The brown hair gene is dominant, so it is capitalized, and because it is dominant he has brown hair.
Homozygous indicates two identical genes for a hereditary characteristic. In this case, the woman has two genes for red hair (bb). The genes are in lower case since they are recessive. She only has genes for red hair, so she has red hair.
You can solve this type of problem by filling out a Punnett Square as shown below:

Children with the genes BB will have brown hair, but none of the children have this combination of genes.
Children with the genes Bb will also have brown hair (because B is dominant), and 2 out of every 4 children, or 50%, will have brown hair.
Children with the genes bb will have red hair, and 2 out of every 4 children will have red hair.
Homozygous indicates two identical genes for a hereditary characteristic. In this case, the woman has two genes for red hair (bb). The genes are in lower case since they are recessive. She only has genes for red hair, so she has red hair.
You can solve this type of problem by filling out a Punnett Square as shown below:

Children with the genes BB will have brown hair, but none of the children have this combination of genes.
Children with the genes Bb will also have brown hair (because B is dominant), and 2 out of every 4 children, or 50%, will have brown hair.
Children with the genes bb will have red hair, and 2 out of every 4 children will have red hair.
Question 4 |
In the 21st century, worker bees in bee colonies have been abandoning their queens and are deserting their hives in record numbers. Known as Colony Collapse Disorder, honeybees have been mysteriously disappearing across the planet—and one area that has been seriously affected is California’s Napa Valley. This issue became more commonly known when The National Agriculture Statistics Service reported in 2008 that only 2.44 million honey-producing hives were in the United States, down from 4.5 million in 1980.
There is no consensus among scientists as to what is causing Colony Collapse Disorder, though the USDA has undertaken a plan of action to stem the collapsing colonies involving several steps: survey and data collection; analysis of samples; hypothesis-driven research; mitigation and preventive action. The first findings from the USDA were published in 2009, and suggested factors such as pesticides, parasites, and pathogens may be possible causes, all of which have affected hives in Northern California.
One researcher has hypothesized that chemical pesticides are solely responsible for colony collapse disorder in Napa Valley. To test her hypothesis she is planning to run an experiment. She has obtained several healthy bee colonies and plans to expose them to pesticides while measuring the health of the colonies.
Which additional information would be the most useful in helping her design this experiment?
The types of pesticides that are used in Napa Valley. | |
The types of parasites that are present in Napa Valley. | |
The types of pathogens that are present in Napa Valley. | |
The types of pesticides that the USDA evaluated. |
Question 4 Explanation:
In order to best support her argument that the pesticides are responsible for colony collapse, the researcher should expose the healthy bee colonies to the same pesticides used in Napa Valley. If she uses the same pesticides, as well as a control, and the colony exposed to the pesticide does collapse, then her hypothesis is well supported.
Question 5 |
Fahrenheit is a thermodynamic temperature scale, where the freezing point of water is 32 degrees Fahrenheit (°F) and the boiling point 212°F (at standard atmospheric pressure). Celsius, also called centigrade temperature scale, is a scale based on 0° for the freezing point of water and 100° for the boiling point of water. In order to convert Fahrenheit to Celsius, the following formula can be used:


A measure of 70 °F is equal to which of the following in Celsius? You may use your calculator.
6.9° | |
21.1° | |
38.9° | |
158° |
Question 5 Explanation:
Substitute the given values into the temperature conversion equation:
°C = (°F − 32) * 5/9
°C = (70 − 32) * 5/9
°C = 38 * 5/9
°C = 21.1111
°C = (°F − 32) * 5/9
°C = (70 − 32) * 5/9
°C = 38 * 5/9
°C = 21.1111
Question 6 |
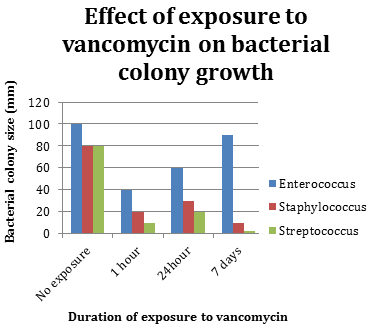
A study was done to measure the effectiveness of an antibiotic on different bacteria. The antibiotic Vancomycin was tested on 3 types of bacteria: Enterococcus, Staphylococcus, and Streptococcus. Bacterial growth was measured at 3 different durations of time exposure to the antibiotic: 1 hour, 24 hours, and 7 days. The rate of bacterial growth was measured by bacterial colony size at each time interval. The data for each duration was calculated and compiled into the graph shown below. As a control, each bacteria species was also grown with no exposure to the antibiotic. This control culture was measured after 7 days.


What are the independent and dependent variables in this experiment?
The independent variable is the duration of exposure to Vancomycin; the dependent variable is bacterial colony size. | |
The independent variable is the bacterial colony size; the dependent variable is the duration of exposure to Vancomycin. | |
The independent variable is the bacterial colony size; the dependent variable is the type of bacteria. | |
The independent variable is the duration of exposure to Vancomycin; the dependent variable is the type of bacteria. |
Question 6 Explanation:
An independent variable is a variable that is changed or controlled in a scientific experiment in order to test the effects on the dependent variable. In this case the researchers could control the duration of exposure and the type of bacteria. The dependent variable responds to the independent variable. It is called dependent because it "depends" on the independent variable.
In this case the bacteria colony size depends on the duration of exposure and the type of bacteria. In this study there are two independent variables and there is one dependent variable. The independent variables are the duration of exposure to Vancomycin and the type of bacteria used. The dependent variable is the bacterial colony size, which depends on length of exposure to the antibiotic.
In this case the bacteria colony size depends on the duration of exposure and the type of bacteria. In this study there are two independent variables and there is one dependent variable. The independent variables are the duration of exposure to Vancomycin and the type of bacteria used. The dependent variable is the bacterial colony size, which depends on length of exposure to the antibiotic.
Question 7 |
A study was done to measure the effectiveness of an antibiotic on different bacteria. The antibiotic Vancomycin was tested on 3 types of bacteria: Enterococcus, Staphylococcus, and Streptococcus. Bacterial growth was measured at 3 different durations of time exposure to the antibiotic: 1 hour, 24 hours, and 7 days. The rate of bacterial growth was measured by bacterial colony size at each time interval. The data for each duration was calculated and compiled into the graph shown below. As a control, each bacteria species was also grown with no exposure to the antibiotic. This control culture was measured after 7 days.


Based on these results, Vancomycin is most effective against:
Enterococcus | |
Staphylococcus | |
Streptococcus | |
It is equally effective against Staphylococcus and Streptococcus. |
Question 7 Explanation:
An effective antibiotic prevents the growth of bacteria. So, to determine which bacteria Vancomycin is most effective against, locate the bacteria with the smallest colony size across each exposure time. According to the chart, Streptococcus has the smallest colony size at all three durations.
Question 8 |
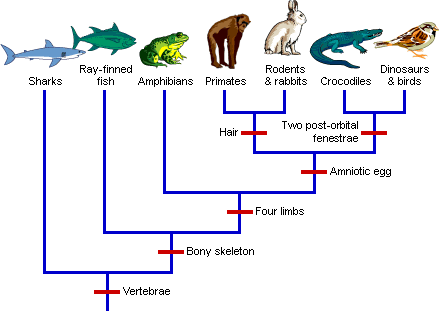
A cladogram is a diagram that organizes species into groups based on their similarities. It also shows evolutionary relationships among the groups.

Based on the information in this cladogram, which of these statements is true?
Primates evolved from sharks. | |
The original ancestor of all the species on the cladogram had a bony skeleton. | |
Dinosaurs are more closely related to crocodiles than they are to amphibians. | |
Ray-finned fish have an amniotic egg. |
Question 8 Explanation:
Use the cladogram to evaluate each answer choice.
The cladogram shows that dinosaurs and crocodiles are closely related. They both have an amniotic egg and they both have two post-orbital fenestrae. Amphibians branched off before either of these developments, so they are less closely related.
Primates and sharks are on two different branches of this cladogram, so primates did not evolve from sharks. The cladogram shows that the original ancestor of all of these species was a vertebrate, but the original ancestor of the shark did not have a bony skeleton. Ray-finned fish branched off before the evolution of the amniotic egg.
Question 9 |
A laboratory produces and tests a new flu vaccine designed to prevent the influenza virus. The lab tests four dosages of the vaccine on 400 individuals, male and female, between the ages of 18 and 65 over a 3-month trial during flu season. Each group has 100 randomly assigned participants. The table shows the dosages of the flu vaccine given to each individual in the group, as well as the number of individuals that reported having influenza during the 3-month trial.


The laboratory has published findings in which they claim that the new flu vaccine can prevent the influenza virus. However, a competing lab has criticized the findings, claiming that there is an error in the way the groups were setup. What changes to the test setup would eliminate the source of the error?
Test a fifth group at a higher dosage than 200 mg. | |
Only use two groups instead of four groups so the data is easier to compare. | |
Make the difference in the dosage amount between the groups much larger. | |
Add a fifth group to the study and set the dosage to 0 mg/day. |
Question 9 Explanation:
The problem with the setup of the groups is that there is no control group. A control group is a group that does not receive any treatment. The results of the treated groups should be compared to the results of the control group in order to evaluate the effects of the treatment. All four groups in this experiment received a dosage of the flu vaccine. One group receiving no dosage should have been added in order to see how many flu cases occurred with no vaccine.
Question 10 |

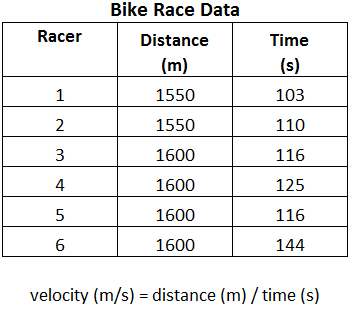
What is the mean time, in seconds, for all of the bicycle racers?
116 | |
714 | |
119 | |
144 |
Question 10 Explanation:
The arithmetic mean, also known as the average, is a way to describe the center of a data set. It is calculated by summing the data points of a data set and dividing by the total number of data points in the set. In this case, the average time, which contains 6 data points, is the data set. Add together the individual times and divide by 6 to calculate the mean time:
Mean = (103 + 110 + 116 + 125 + 116 + 144) ÷ 6
Mean = 714 ÷ 6
Mean = 119
Mean = (103 + 110 + 116 + 125 + 116 + 144) ÷ 6
Mean = 714 ÷ 6
Mean = 119
Once you are finished, click the button below. Any items you have not completed will be marked incorrect.
There are 10 questions to complete.
|
List |
Next Test:
GED Science Practice Test 3 >>
